Experiences are central to leisure consumption, and events and festivals are rapidly becoming one of the most widespread forms of experience production. Event managers and designers work hard to ensure that the consumer will enjoy the event experience, and as a result have more fun, spend more money and come back in the future. The major challenge facing the events industry, however, is understanding exactly what the visitor experiences at an event, and what elements of the experience trigger them to visit the event in the first place and to have a memorable visit. This is because the concept of experience is very complex.
Experience is inherently personal, and comprises a number of different elements. Previous research has identified these as broadly the affective (or emotional) component, the cognitive component (knowing, learning, and understanding) and the conative component (or the actions that are related to the experience). So event visitors feel, learn and do things at events that together contribute to their overall experience. But the picture is also complicated by the fact that the visitor experience is affected by their journey to and through the event. For example Leisure & Events researchers Dorothé Gerritsen and Ronald van Olderen (2014) showed the value of analyzing the different ‘touchpoints’ that visitors encounter in their journey through an event experience. Research by staff and students at Breda University of Applied Sciences (de Geus et al., 2015) also showed that in the case of events there was an additional experience component: novelty. Perhaps not surprisingly, every edition (or every day) of an event is different, depending on factors like the line-up of artists, the weather or the mood of the crowd. So people also visit events seeking different, or novel experiences. This also parallels much recent work in the field of visitor studies, which suggests that visitor experience at attractions is influenced not only by the individual characteristics of the visitors, but also by the experience context provided by the producer (the setting, design, interpretation, etcetera).
Greg Richards:
Surprisingly levels of active involvement were lowest for Carnival in Brazil.The Event Experience Scale
To understand the way in which event experience work, it is important to have a tool that can measure the experience of different visitors at different events. This can enable us to analyse the effect of individual visitor characteristics on the experience, as well as the event setting (event type, location), as well as giving the possibility of exploring the experience at different stages in the visitor journey. De Geus et al. therefore reviewed the leisure experience literature to develop an experience scale that could capture the different dimensions of experience and which could be used at many different events. This was tested a number of events and was found to be useful in measuring the different dimensions of the event experience. In order to find out more about what factors affect the experience of events, the Event Experience Scale (EES) was applied to a range of different events in countries including the Netherlands, the UK, Bulgaria, Mexico, Brazil and the USA. The research covered a wide range of different events, including folk festivals, jazz festivals, pop festivals, art festivals, gastronomic events and business events. Using the EES we were able to develop an ‘experience footprint’ of these events and make comparisons in terms of the visitor experience and the relationship between their experiences and antecedents such as visitor characteristics and previous visits, and the impacts of the experience, including visitor spending, satisfaction and intention to return. An initial comparison of the main dimensions of experience (affective, cognitive, conative and novelty) indicated that the affective component scored highest overall, closely followed by the cognitive dimension. The active dimension scored least, probably because at many events the visitors are effectively spectators rather than actively participating in the event itself. This is particularly evident for Brazilian Carnival (see Figure 2). Three events, three different experiences?
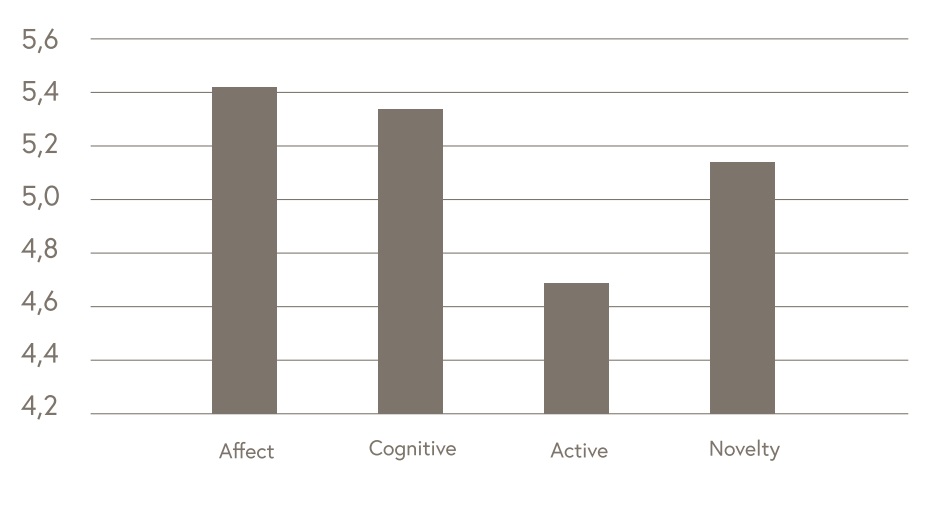
Figure 1: Scoring of experience dimensions at events (1= low, 7=high)The B-Side Festival in Weymouth and Portland, Dorset, UK, provides visitors with “moments of reflection, beauty, surreal interventions and unexpected encounters with art”. The biennial festival attracts around 12,000 visitors to an eclectic mix of visual art, text, sound, installation, live art and performances. The events are presented against the backdrop of the Portland Peninsula and many events are staged in the open air. Carnival is a way of life in Brazil, and each area of the country has its own style of celebration. Carnival in Rio is focused on parades by the samba schools, samba musical bands (Bandas), or ‘street carnival bands’ and smaller, more informal groups called blocos. The Rio Carnival is a major industry that generates an estimated $1 billion in revenues each year. In Recife carnival is marked by the parade of the largest carnival block in the world, the Galo da Madrugada. Instead of samba, the predominant music is Frevo. In Salvador carnival centres on the trio elétricos, trucks or float equipped with a high power sound system and a stage for music performance. At the end of the parade the trucks gather in a space where performers can mingle with the audience. The experience of Brazilian carnival should therefore differ according to location.
Greg Richards:
Average spend per person generally increases as the experience score rise.The Festival Internacional Cervantino has been held annually in the city of Guanajuato in central Mexico since 1972. The festival has grown to become the most important international artistic and cultural event in Mexico and Latin America. The Festival has a special emphasis on artistic creations in the Spanish language, with the original tradition of performing Cervanto’s ‘entremeses’. The ‘Cervantino’ labels itself as ‘an emblematic gathering for the world’, which takes place in the colonial city of Guanajuato, which has been designated World Cultural Heritage by UNESCO.
The experience footprint
When we look at the ‘experience footprints’ of the three events (Figure 2), we find an interesting mix of convergences and differences. In particular, in spite of the different event formats and settings, levels of excitement were similarly high at all three events. This indicates that different visitors are able to get excited about different forms of content. Perhaps surprisingly levels of active involvement were lowest for Carnival in Brazil and highest for the Cervantino. This indicates that ‘active involvement’ may be seen in different ways, depending on the event. Because Brazilian carnival is largely based on parades in which the Samba schools and blocos perform, spectators may not feel themselves to be active. On the other hand, Carnival stimulated reflection, with most people agreeing that they reflected on ideas they got during carnival and that there were aware of their own values. It seems that the arts events at the B-Side Festival stimulate different sensations, with visitors most likely to agree that they were thinking during the event, but much less likely to have experience feelings of intimacy or being emotionally recharged. This presents a picture of a more abstract, intellectual though process triggered by contemporary arts presentations.
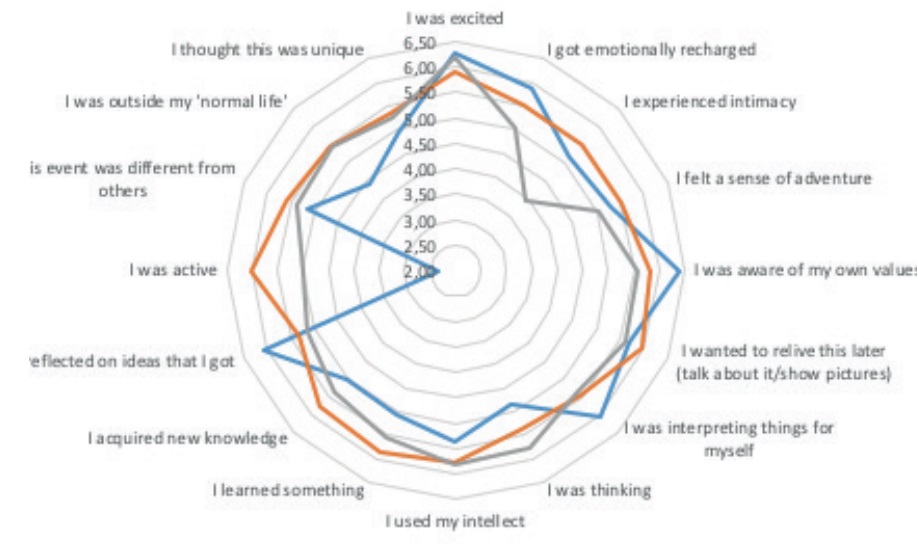 Figure 2: Experience footprints of the events in Brazil, Mexico and the UK
Being able to assess the visitor experience is important because it is also linked to outcomes. For example, average spend per person generally increases as the experience score rise. The cognitive, conative and affective experience dimensions have a direct positive relationship to spending, but the novelty dimension has no influence on spending. Similarly, visitors’ scores on the experience scale were positively correlated with intention to return in the future and intention to recommend the event to others. This indicates that a positive event experience also has a positive behavioral outcome for the event. The event experience will also vary according to the type of visitors. For example, our initial analysis indicates that the strength of all the experience dimensions tends to rise sharply up to the age of 30, and then declines thereafter. Similarly, experience scores tend to rise across all dimensions with increased visitation to the same event. This suggests that learning and skill development related to an event will increase the quality of visitor experience – a hypothesis currently being tested through a Master dissertation at Breda University of Applied Sciences.
Conclusions
In the past event experiences have been treated largely as a black box, with most attention being paid to visit antecedents (motivation) or outcomes (satisfaction). This new research allows us to compile a much more detailed picture of event experiences, and how these differ across individuals, groups, events and cultures. This information is potentially valuable in helping us understand the factors that affect event experiences, and therefore also how event organizers can provide better and more engaging experiences for their publics.
NB: dit artikel verscheen eerder in het magazine Uncover ‘Leisure & Events’ van Breda University of Applied Sciences.